

Reports & Analysis
Reports Overview
The system includes a comprehensive module for reports and analysis related to the assessment of players' subjective wellbeing and fatigue. To access the reports, click Diary → Fatigue Analysis → Reports in the left menu.
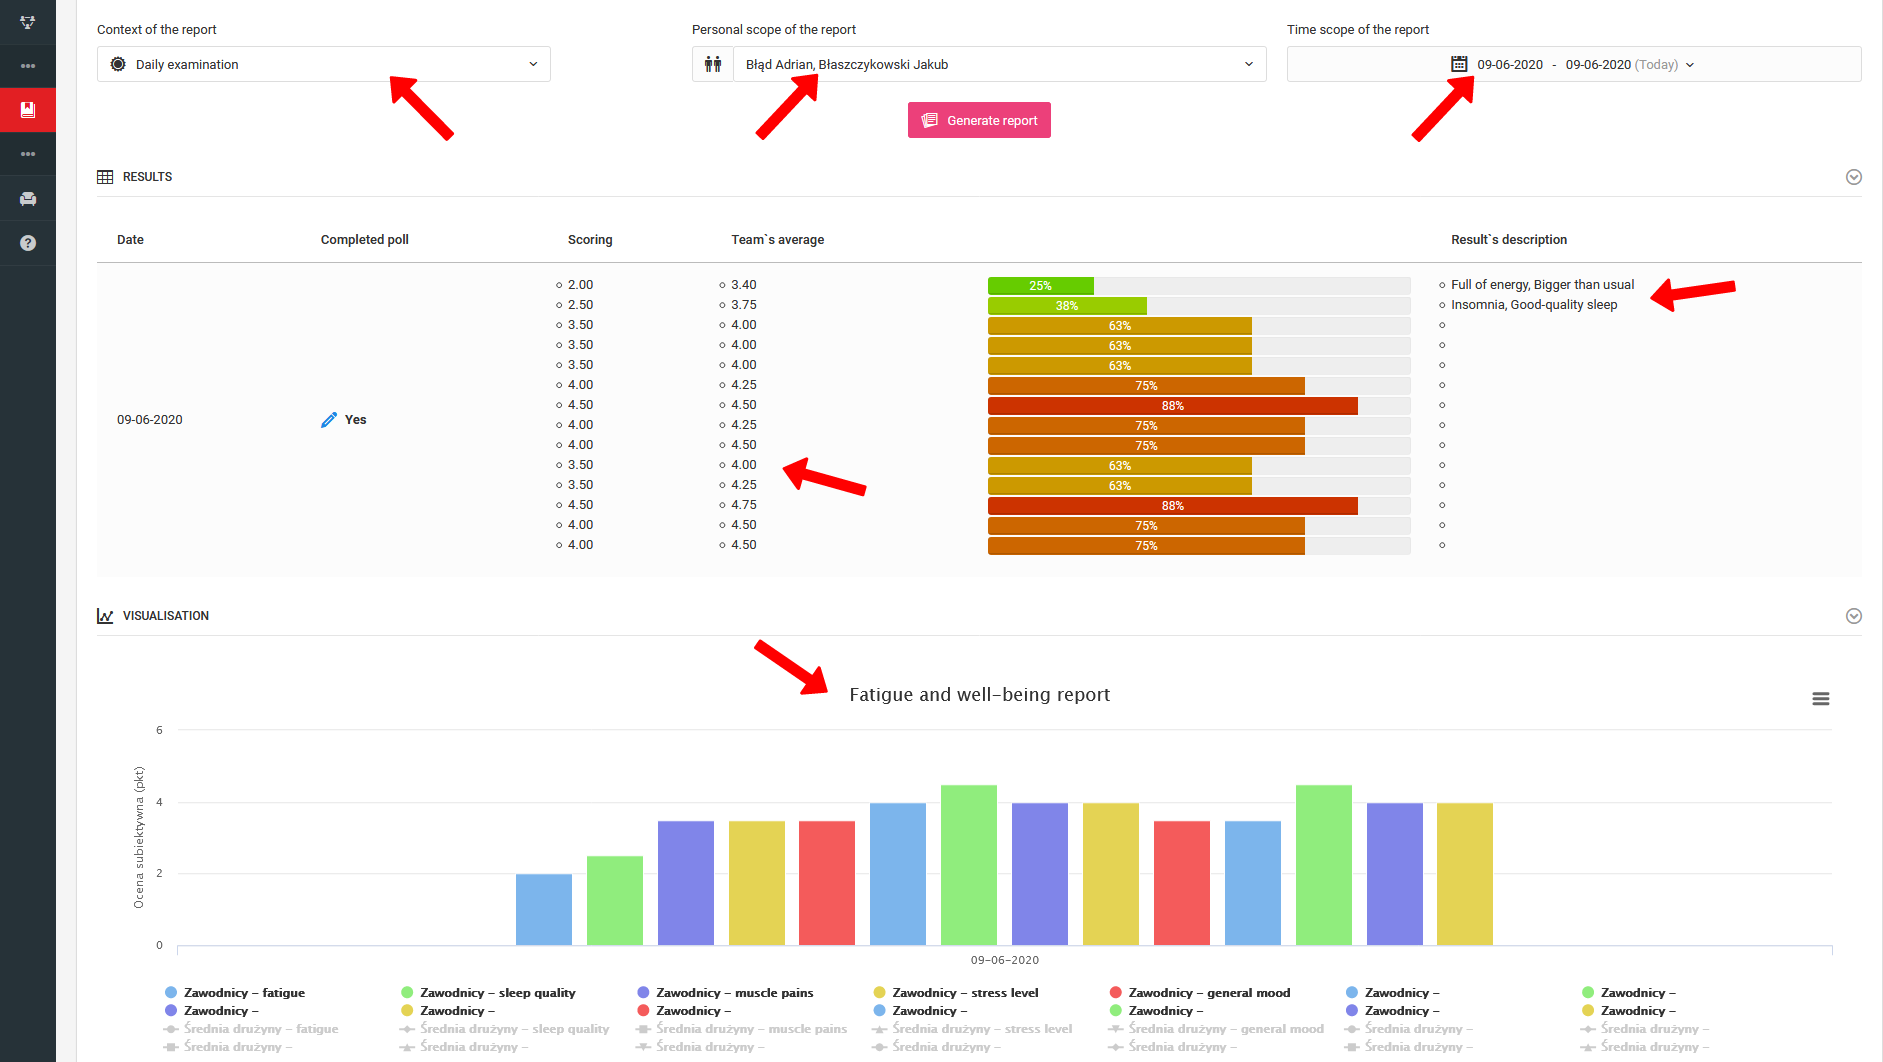
Report Configuration
Preparing a report requires defining several parameters at the top of the page:
- Survey type — which survey the report should cover,
- Player group — the entire team, a selected group, or a single player,
- Time period — the date range to be taken into account when generating the report.
Report Types
The system offers two types of survey reporting:
- Team daily survey — collective data for the entire team,
- Individual post-training survey — detailed results for a single player.
Results presented in the reports include:
- Individual analysis per each measurement (day, training session, match),
- Collective summaries in the form of charts aggregating data on a single timeline,
- Percentage change in results relative to the last survey conducted,
- The dominant response among players.
Each chart can be saved as a JPG or PNG file and downloaded to your computer.
Collective Report
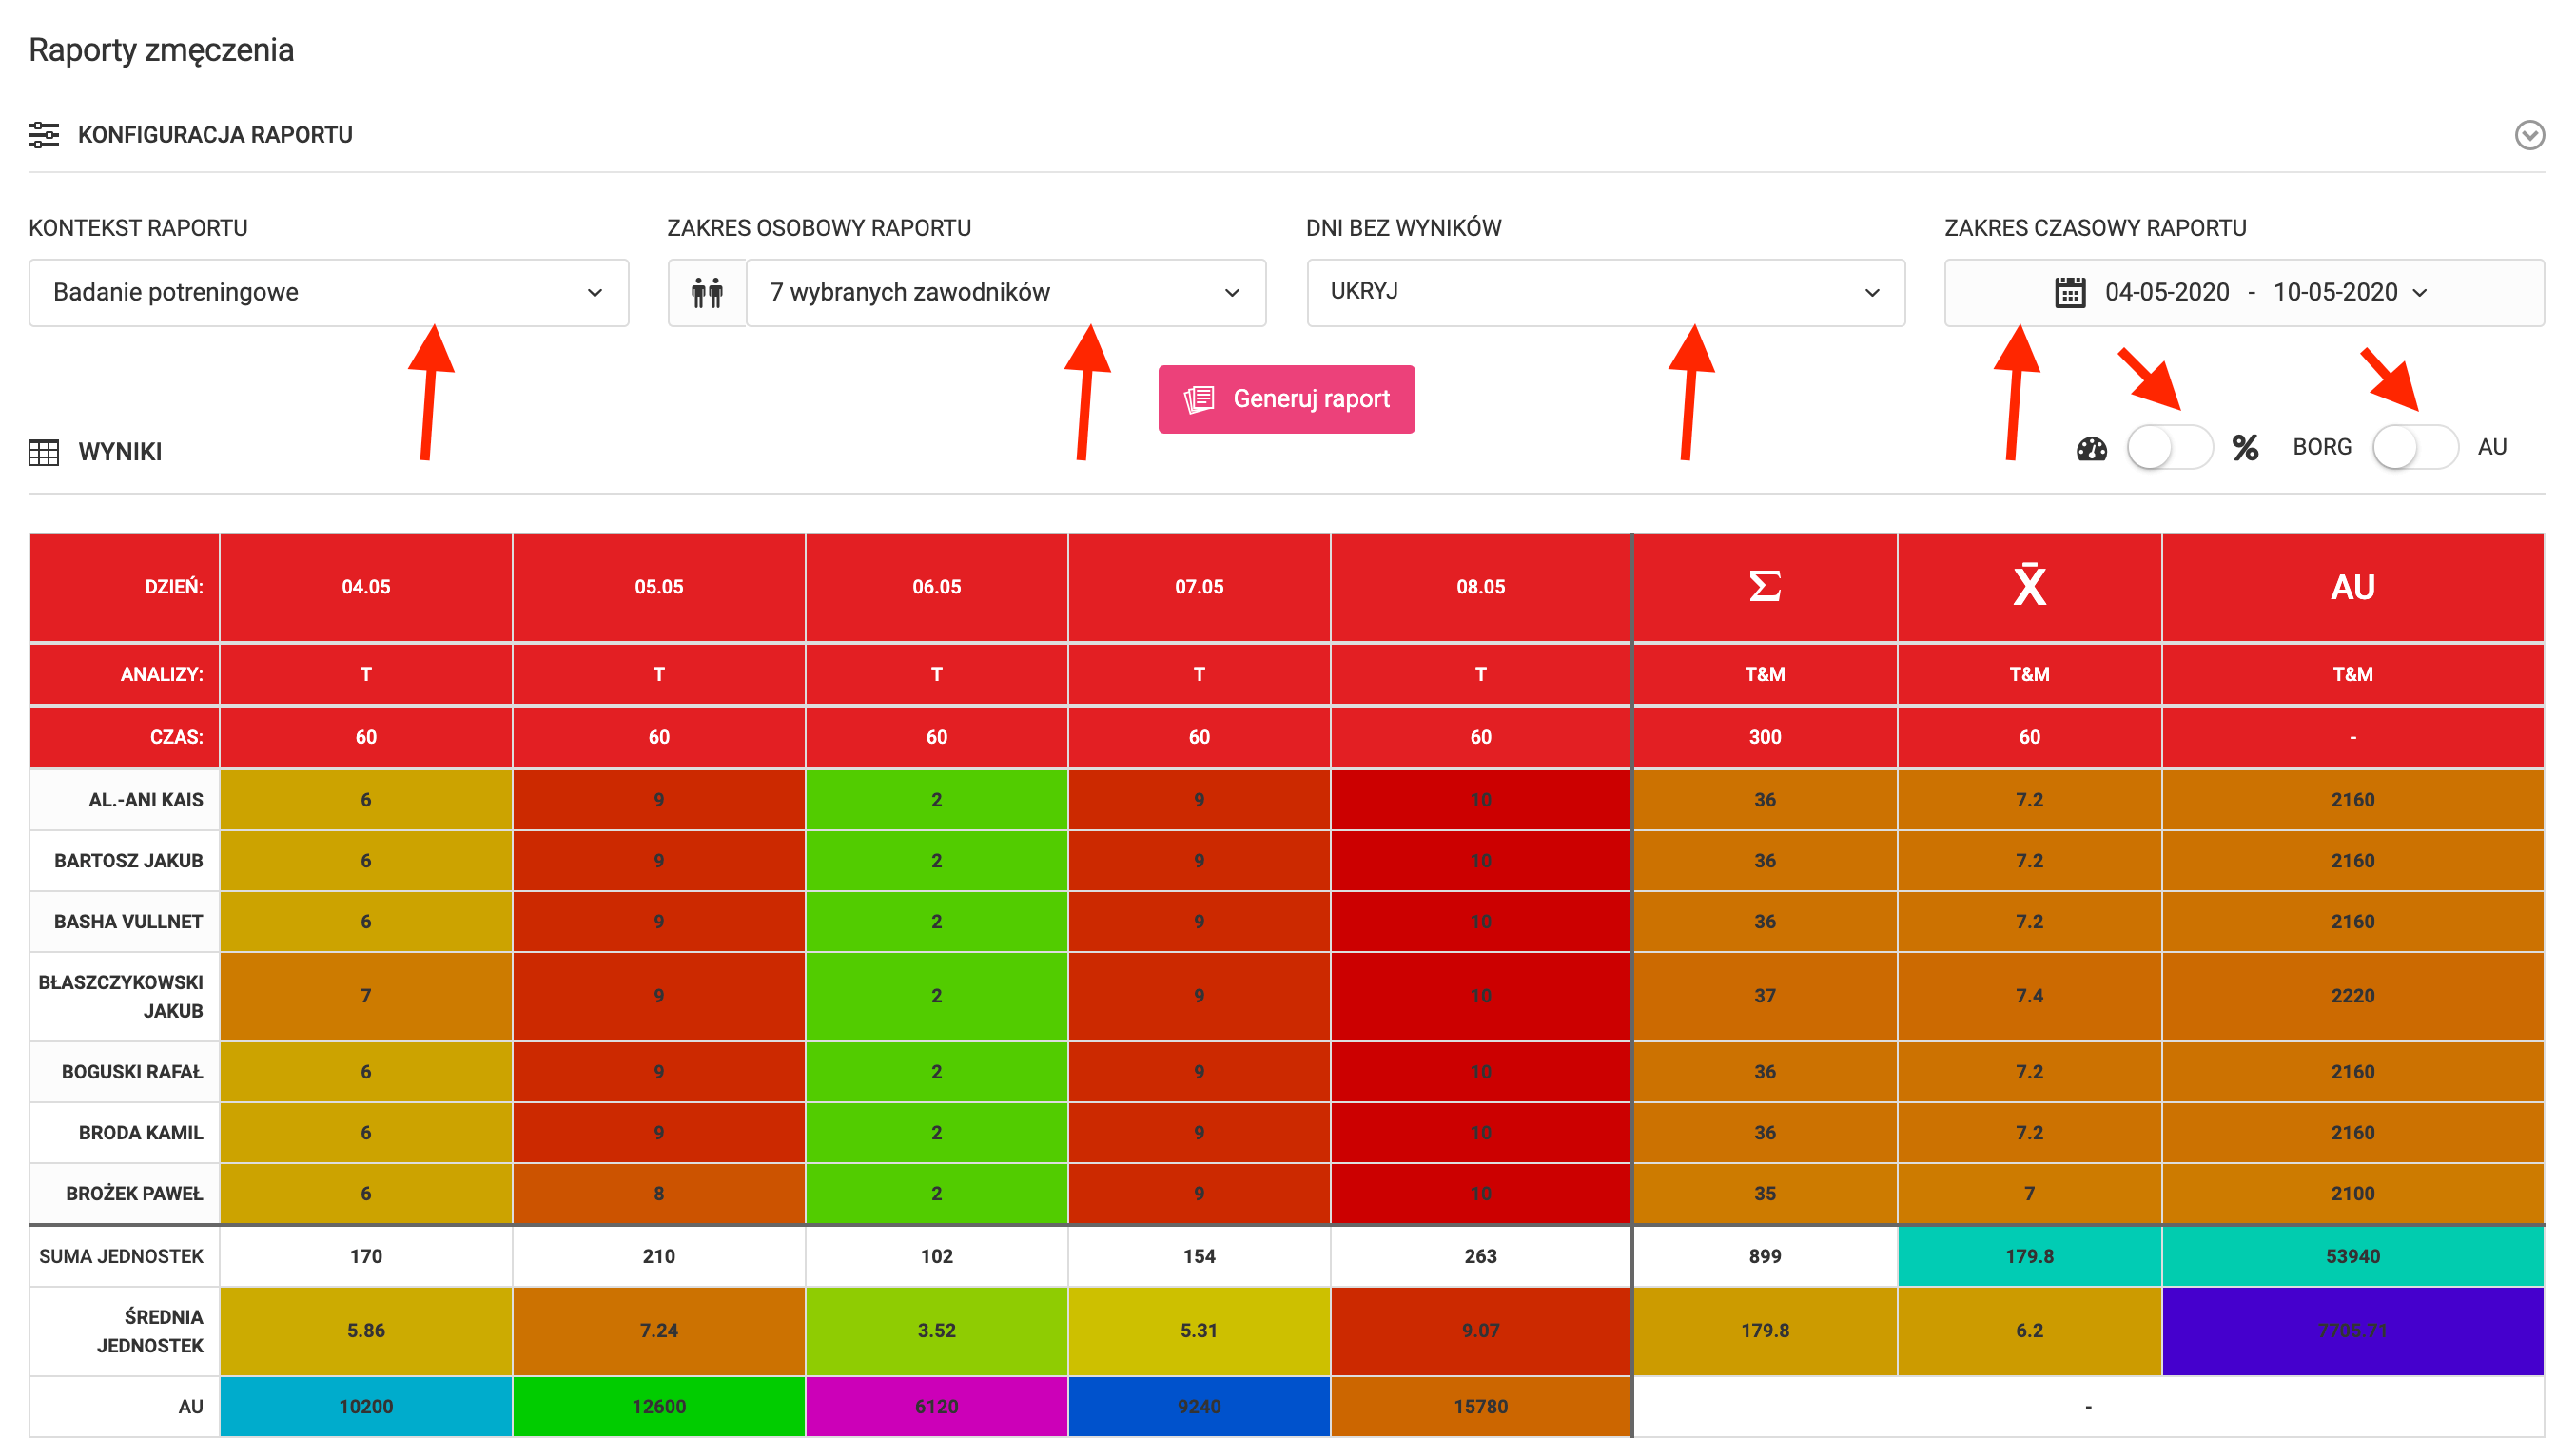
A collective report is also available in the system, presenting a wide range of data along with analyses. Above the report table you will find a configurator with the following options:
- Survey type — select which type of surveys appear in the table,
- Player group — the scope of players included in the report,
- Time range — the period to be taken into account,
- Hide days without measurements — option to remove empty rows from the table.
On the right side above the table there are two sliders:
- Result calculation method — numerical value or percentage,
- Data presentation format — value on a defined scale or calculated fatigue units (AU).
Collective Table Structure
The table contains several types of data:
- Date columns — results of specific player measurements (daily, post-training, post-match),
- Columns after the dark line — summary results, averages, and fatigue units (AU) for the selected period,
- Rows below the dark line — summaries of each survey's results for the entire team.
Color Scale
The colors used in the table correspond to the colors available to players when filling in the survey:
- Light fatigue — green,
- Maximum fatigue — dark red.